Observability
- observability (o11y for short)
- definition of “observability” for software systems is a measure of how well you can understand and explain any state your system can get into
- If you can understand any bizarre or novel state without needing to ship new code, you have observability.
- observability is more relevant in the age of micro services and solutions being composed of many disparate services. not as important in the age of the monolith, where everything happened in a single process + options DB and all the information was available in a single log.
- Observability lets you easily deal with unknown unknowns
“You can understand the inner workings of a system […] by asking questions from the outside […], without having to ship new code every time. It’s easy to ship new code to answer a specific question that you found that you need to ask. But instrumenting so that you can ask any question and understand any answer is both an art and a science, and your system is observable when you can ask any question of your system and understand the results without having to SSH into a machine.”
concepts
- telemetry - refers to data emitted from a system
- OTLP (OpenTelemetry Protocol)
- monitoring - is inherently reactive. traditional monitoring tools work by checking system conditions against known thresholds that indicate whether previously known error conditions are present
- metrics - aggregations over a period of time of numeric data about your infrastructure or application. e.g. system error rate, CPU utilization, request rate for a given service.
- metics require you to define them upfront. if there is an issue that you can’t answer with your pre-defined metrics, you need to add the metric, and try to re-create the problem to populate the new metric.
- Metrics require foresight into what’s going to happen later on.
- SLA (service level agreement) - commitment between a service provider and a customer
- SLI (Service Level Indicator) - actual measurement of a service’s behavior. A good SLI measures your service from the perspective of your users. e.g. the speed at which a web page loads.
- SLO (Service Level Objective) - means by which reliability is communicated to an organization/other teams. This is accomplished by attaching one or more SLIs to business value.
An SLI (service level indicator) measures compliance with an SLO (service level objective). So, for example, if your SLA specifies that your systems will be available 99.95% of the time, your SLO is likely 99.95% uptime and your SLI is the actual measurement of your uptime. Maybe it’s 99.96%. Maybe 99.99%.
trace (aka distributed traces) - made up of a tree of spans, starting with a root span, which encapsulates the end-to-end time that it takes to accomplish a task
span - represents a unit of work
APM - Application Performance Monitoring. monitoring and management of the performance and availability of software applications. APM strives to detect and diagnose complex application performance problems to maintain an expected level of service.
OpenTelemetry
- OpenTelemetry (OTel for short)
- API -The specification portion of OTel libraries that allows developers to add instrumentation to their code without concern for the underlying implementation.
- SDK - The concrete implementation component of OTel that tracks state and batches data for transmission.
- Tracer - A component within the SDK that is responsible for tracking which span is currently active in your process. It also allows you to access and modify the current span to perform operations like adding attributes, events, or finishing it when the work it tracks is complete.
- Meter - A component within the SDK that is responsible for tracking which metrics are available to report on in your process. It also allows you to access and modify the current metrics to perform operations like adding values, or retrieving those values at periodic intervals.
- Exporter - plug-in for the SDK that translates OTel in-memory objects into the appropriate format for delivery to a specific destination
- Collector - standalone binary process that can be run as a proxy or sidecar that receives telemetry data (by default in OTLP format), processes it, and tees it to one or more configured destinations.
- Agent: A Collector instance running with the application or on the same host as the application (e.g. binary, sidecar, or daemonset). -Gateway: One or more Collector instances running as a standalone service (e.g. container or deployment) typically per cluster, data center or region.
Grafana
- web ui for dashboarding
- process - select data sources, write queries against them in promql, influx query
Prometheus
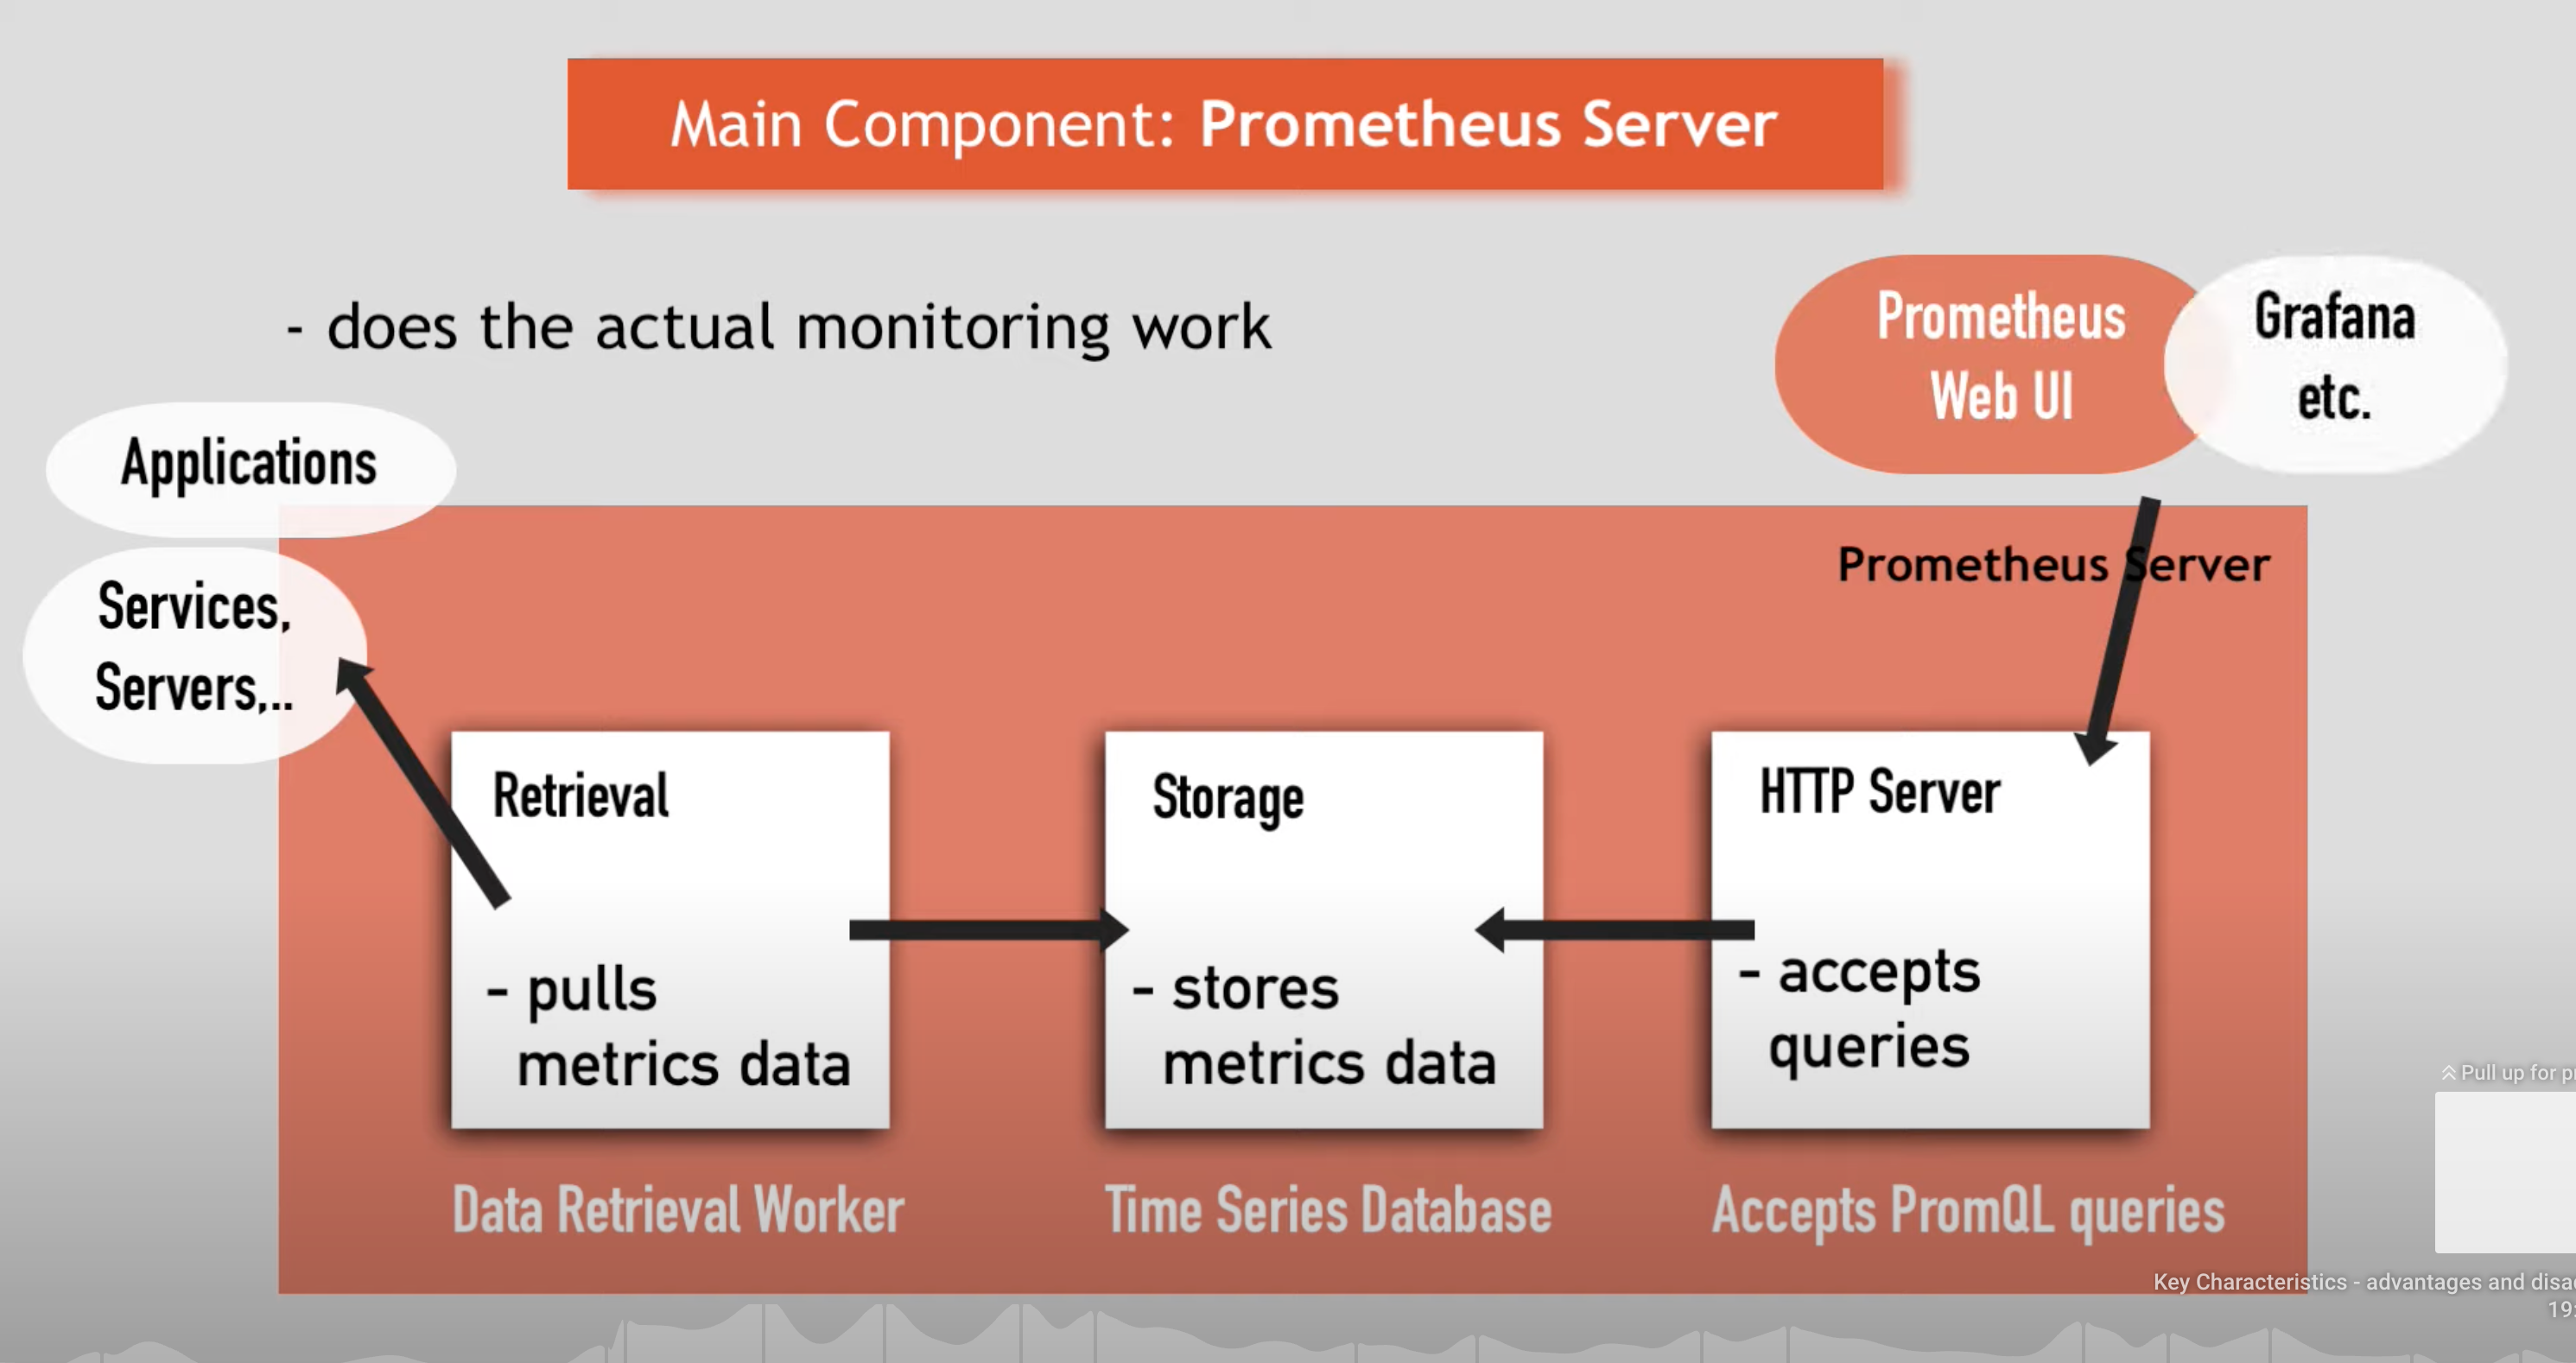
- typically used to monitor containers, micro services, and traditional servers
- originally built at SoundCloud in 2012
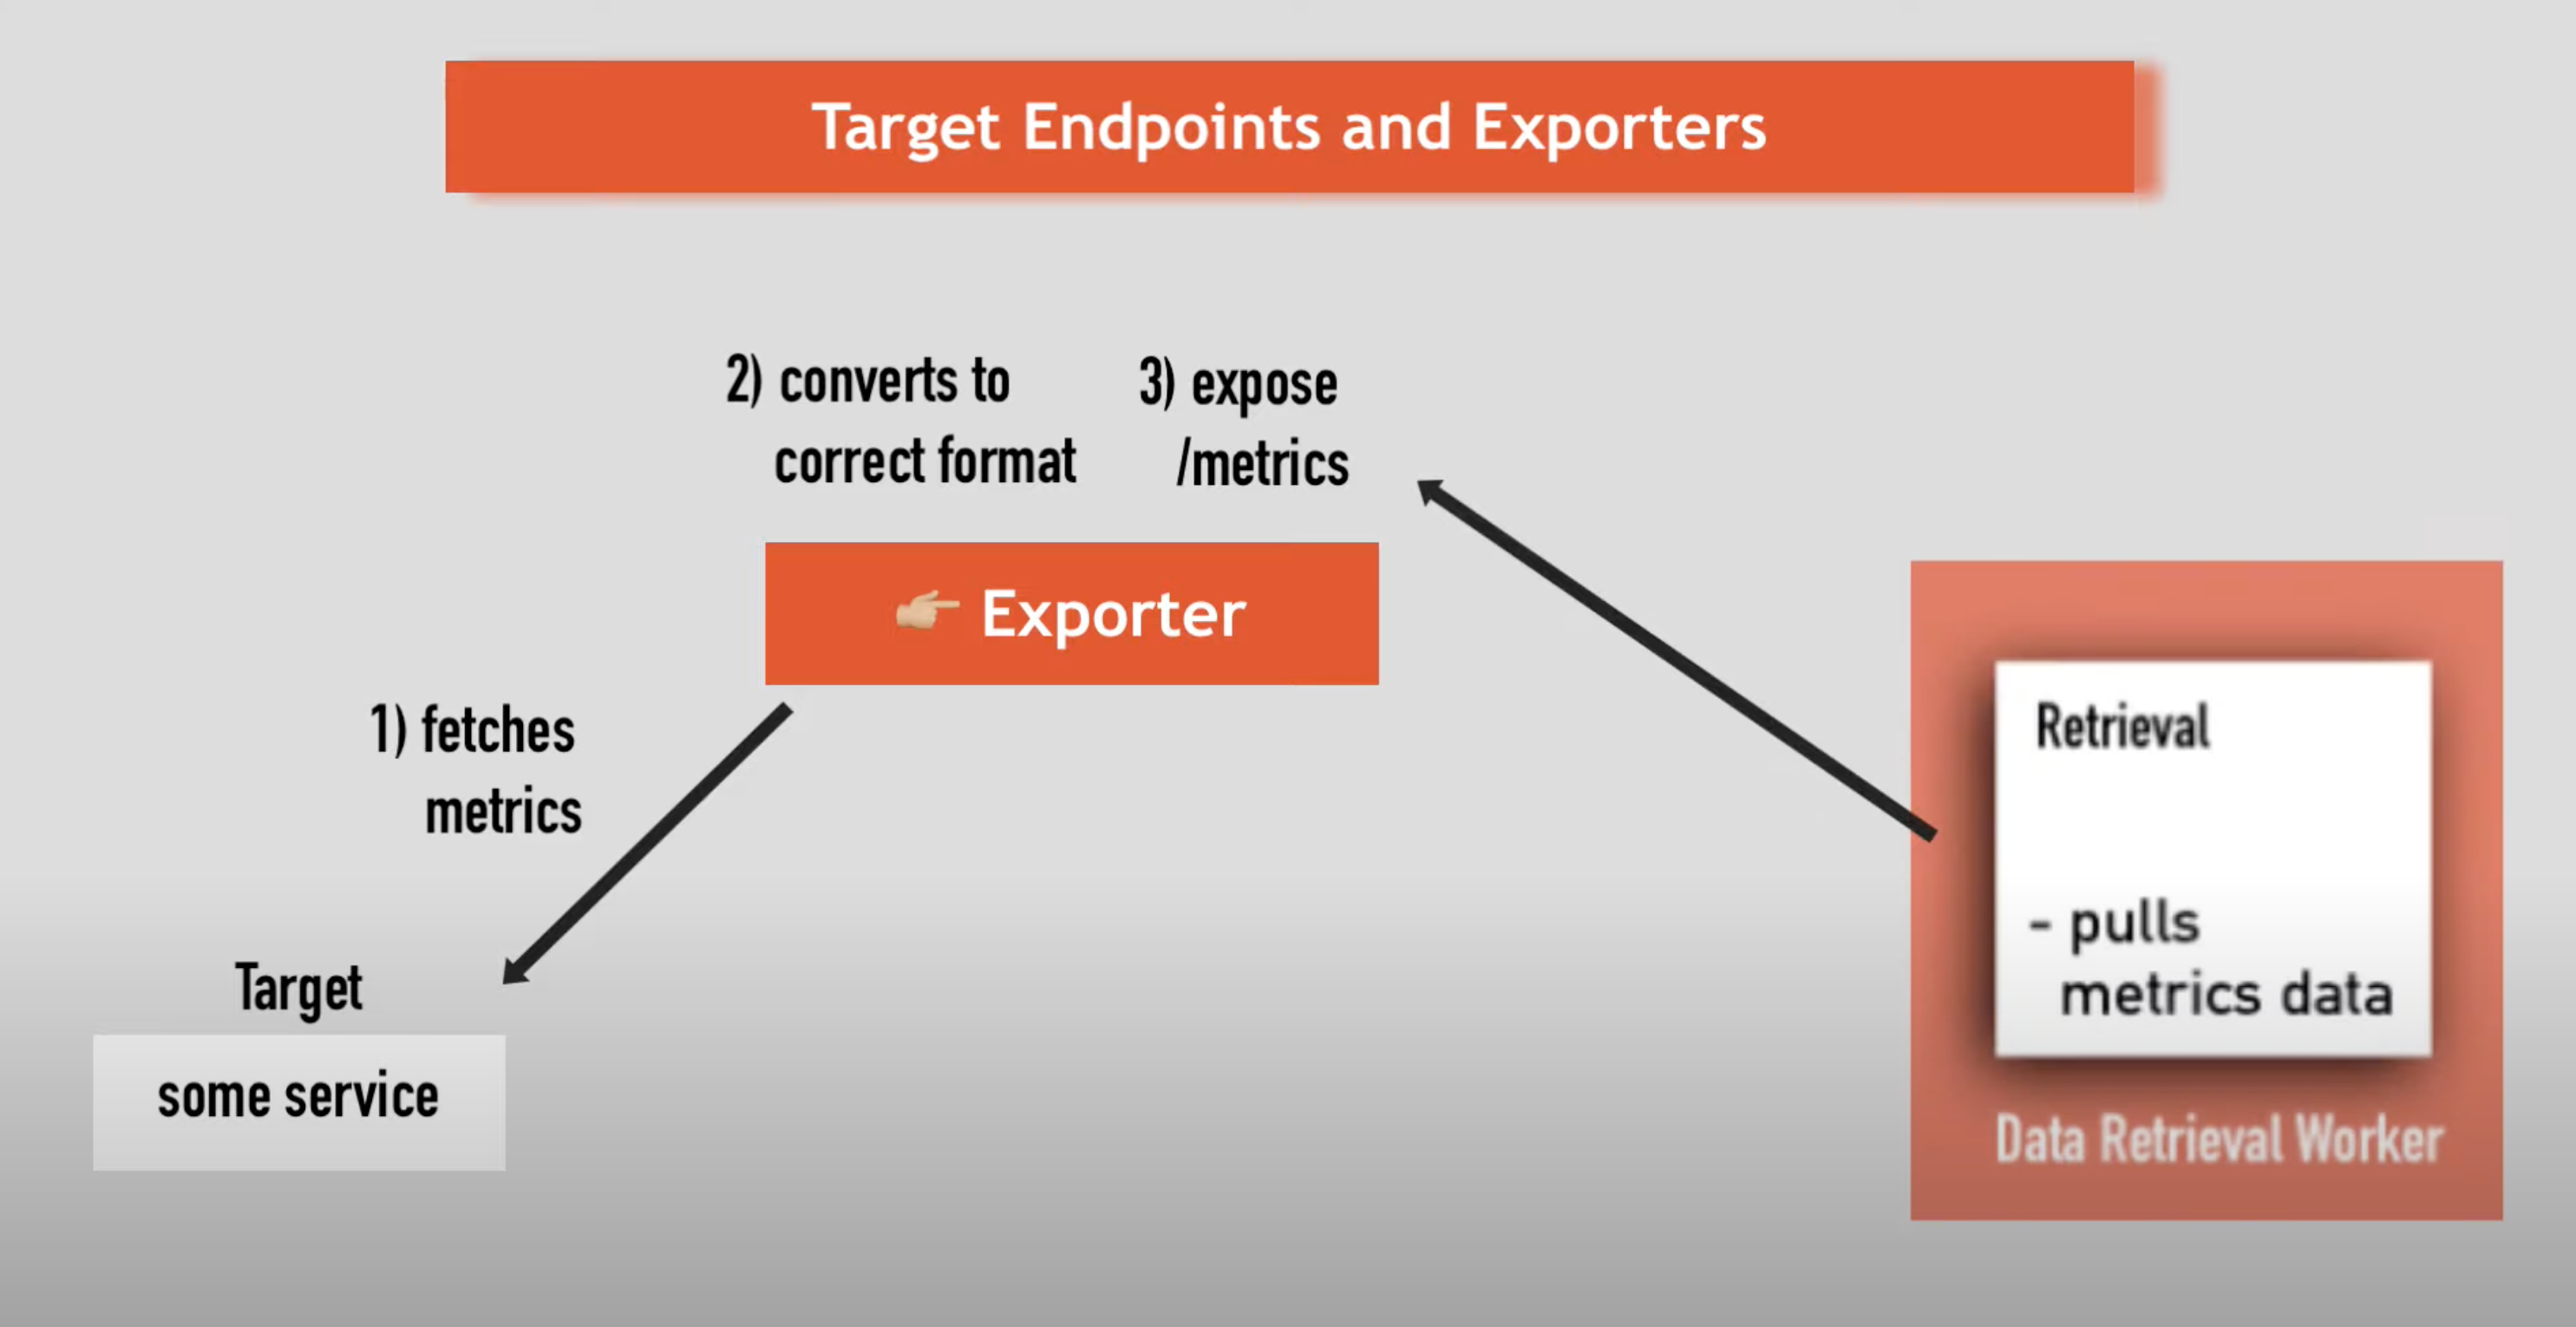
- exporters typically run on the monitored host to export local metrics
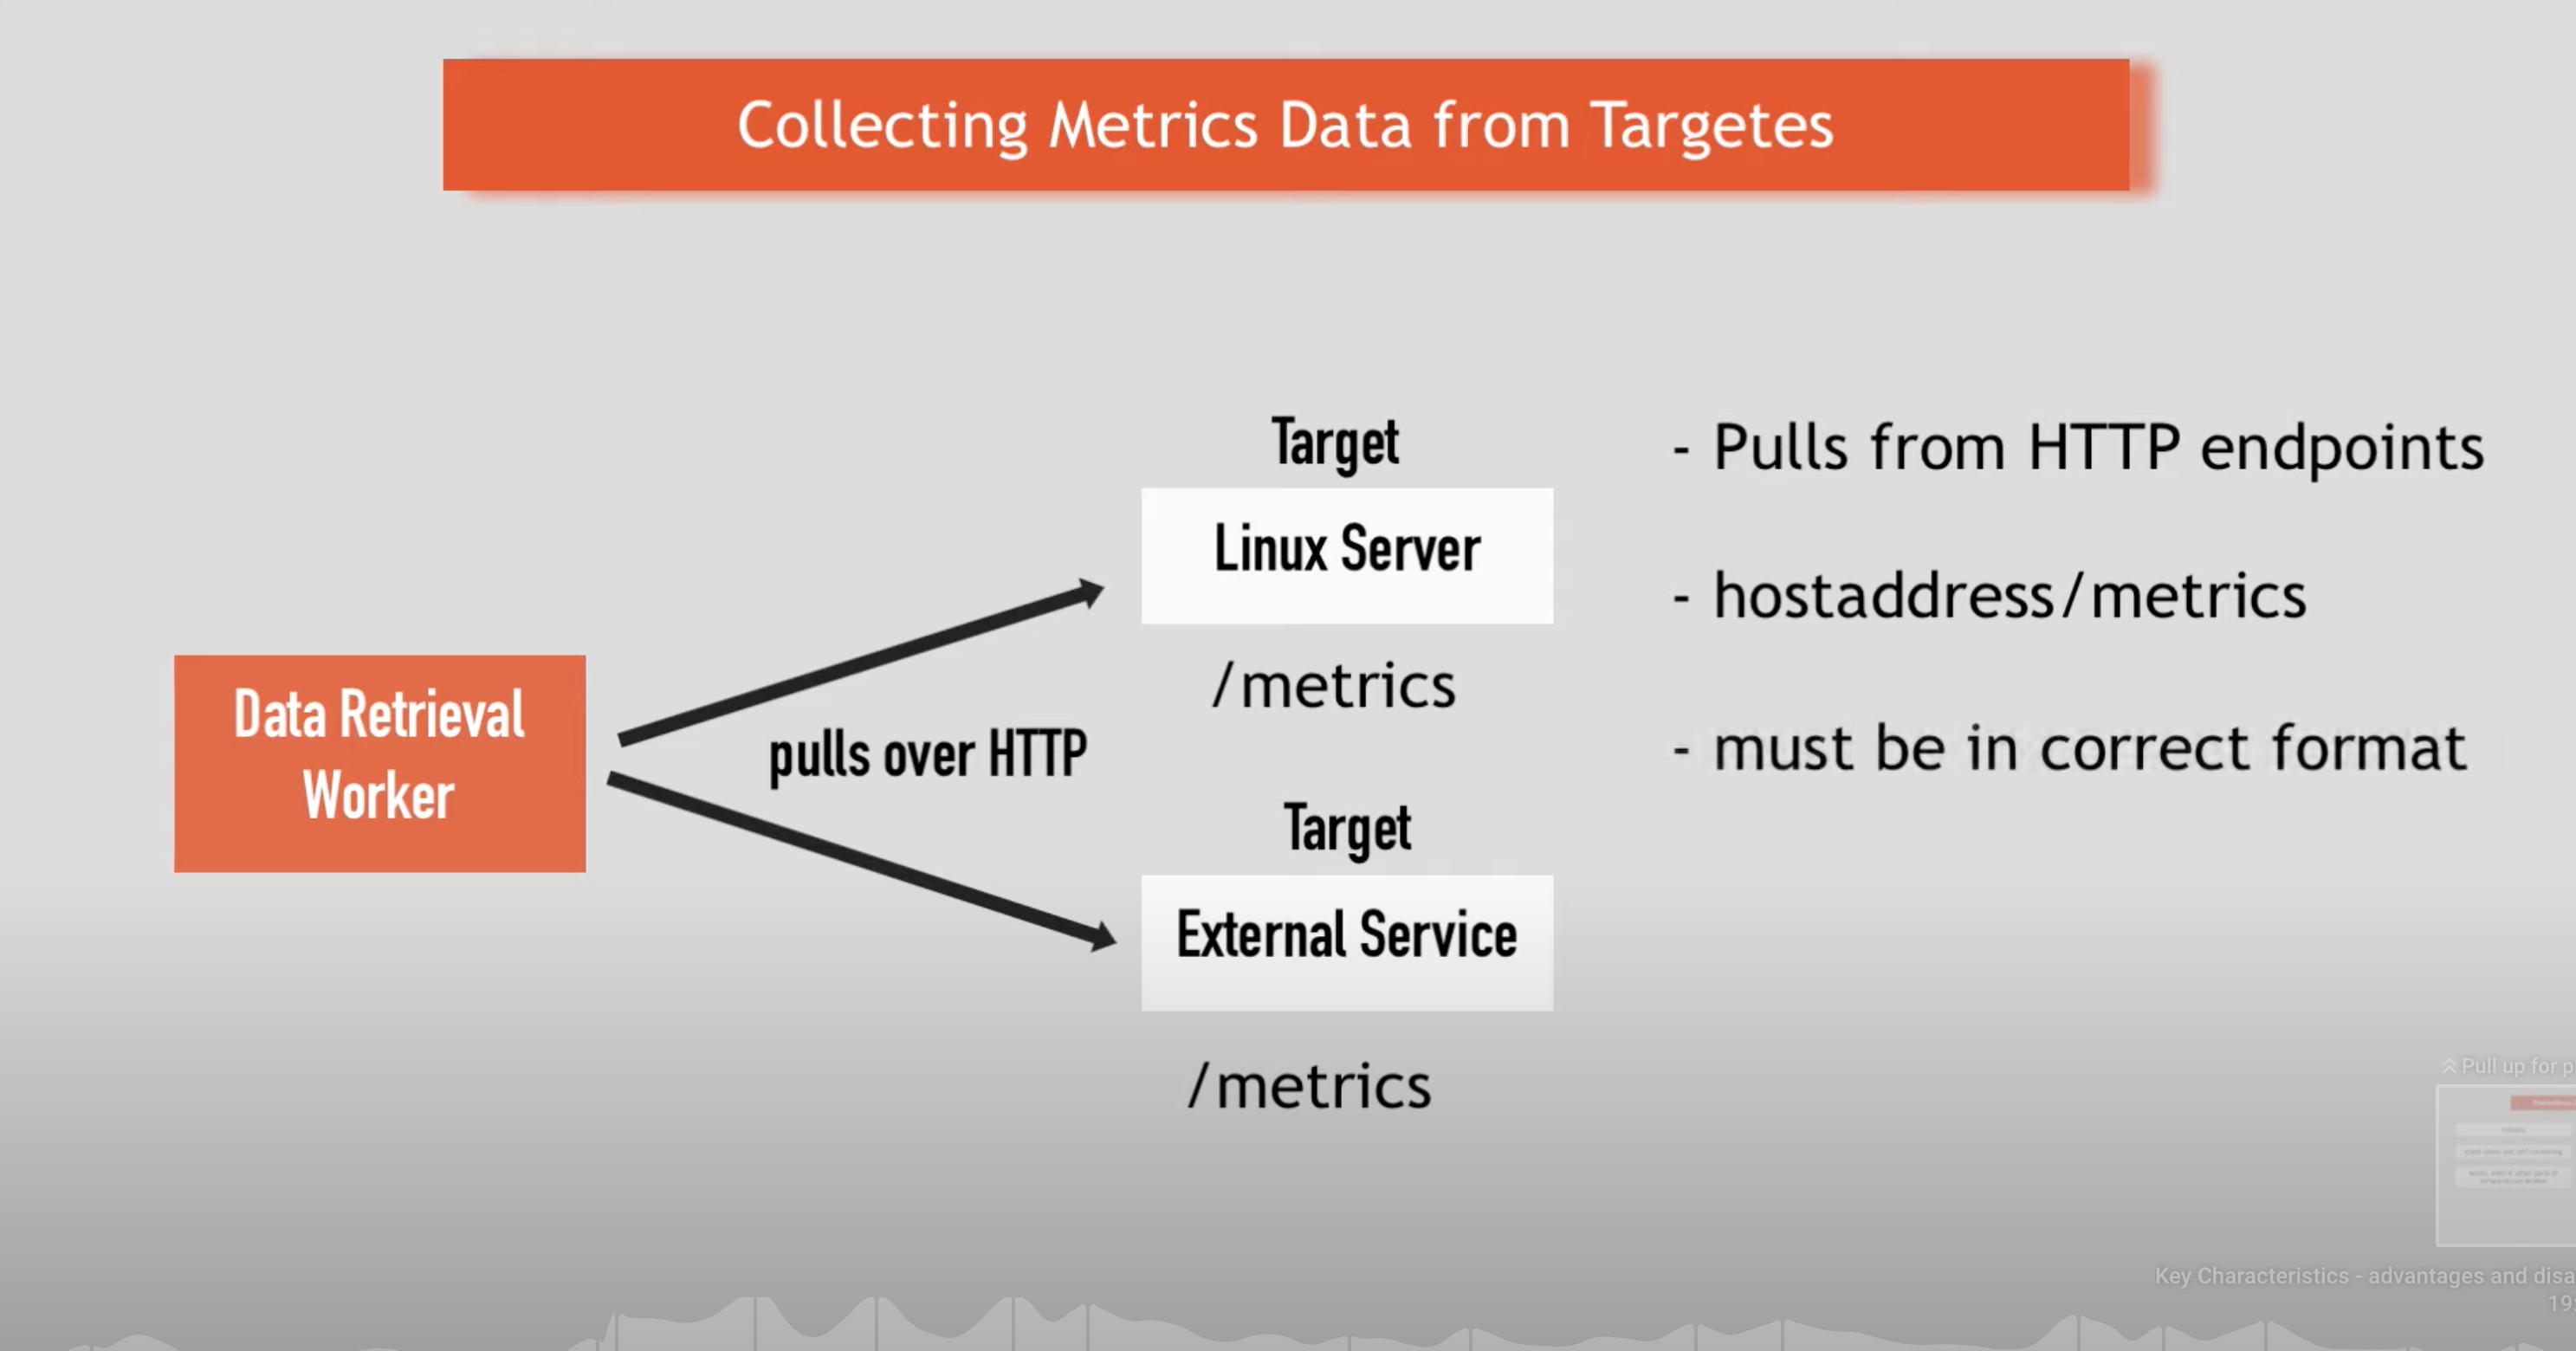
- prometheus server pulls exported via http://hostaddress/metrics by default
- there are client libraries that allow you to expose your own
/metricsendpoint with your custom metrics for custom applications
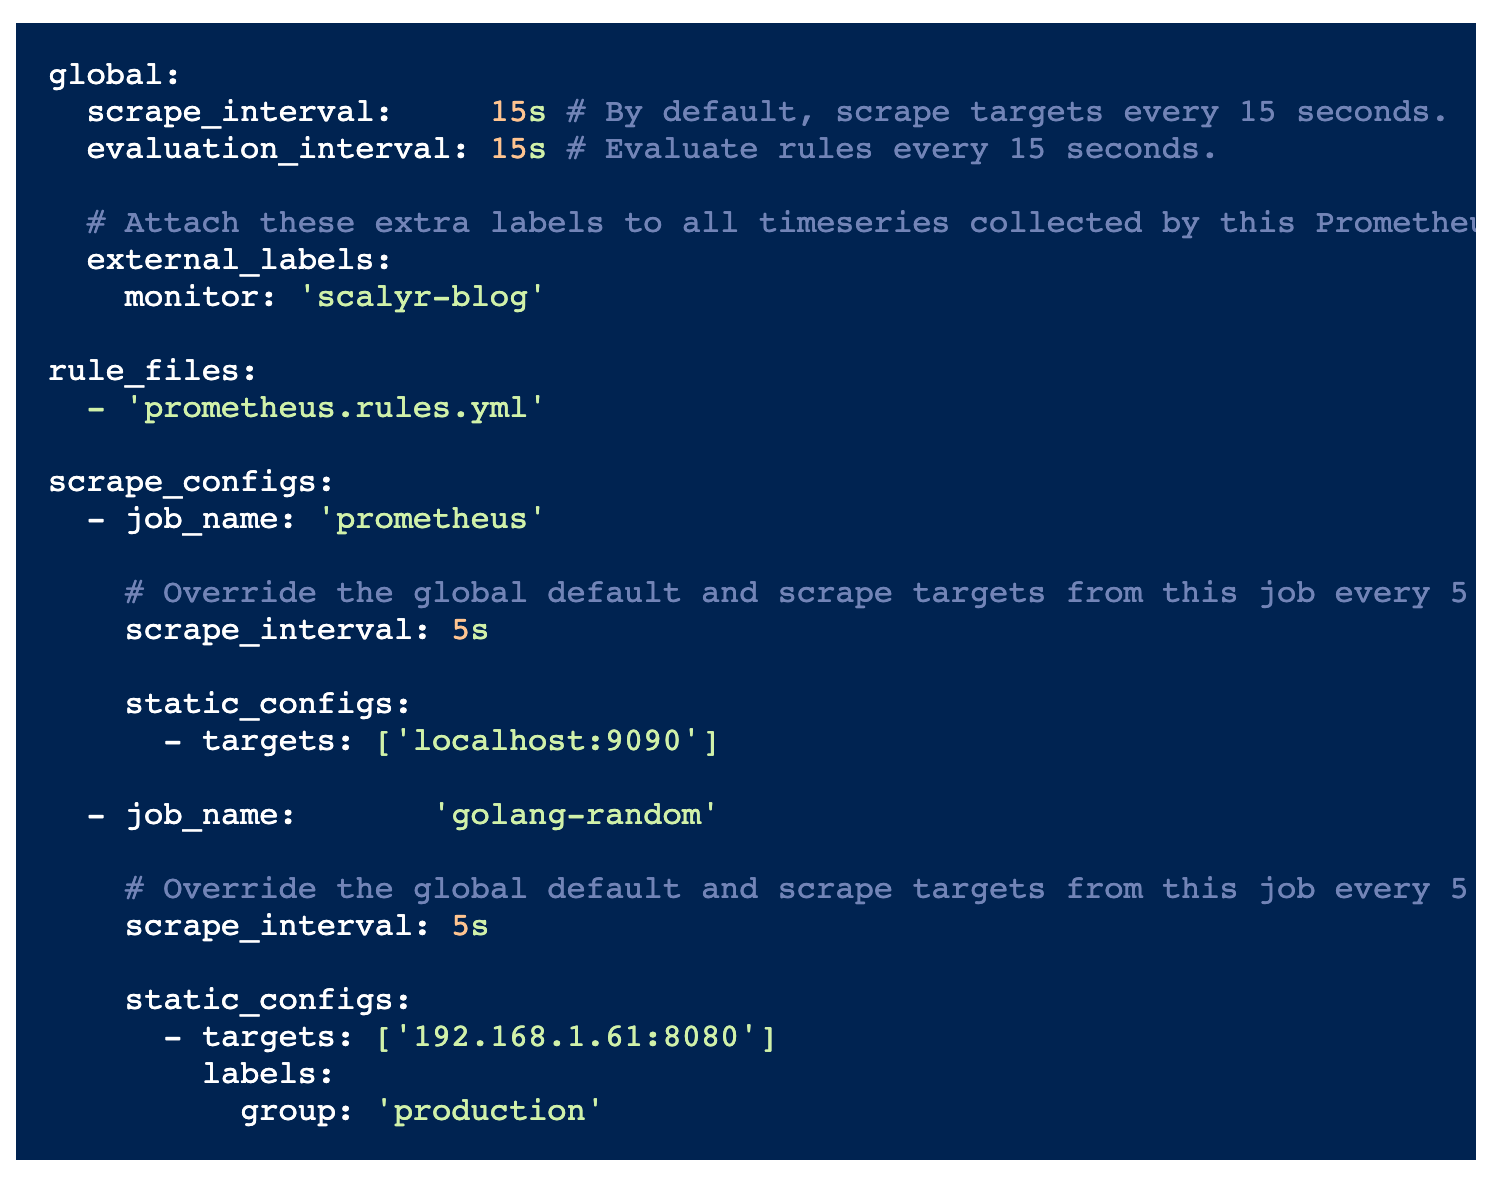
prometheus.yml- specifies the targets to scrape and what interval- Prometheus data store to centralize and store the metrics
- time series are built through a pull model: the Prometheus server queries a list of data sources (sometimes called exporters) at a specific polling frequency.
- Alertmanager to trigger alerts based on those metrics.
- Configuration for alerts can be specified in Prometheus which specifies a condition that needs to be maintained for a specific duration in order for an alert to trigger. When alerts trigger, they are forwarded to the Alertmanager service. Alertmanager can include logic to silence alerts and also to forward them to email, Slack, or notification services such as PagerDuty
- PromQL is the query language used to create dashboards and alerts.
- Prometheus server exposes HTTP interface for PromQL queries
- Prometheus Web UI
- run PromQL queries and see results
- simple visualizations (use graphana for more complex)
Prometheus Server Architecture


Prometheus metric format
A metric is composed by several fields:
- Metric name
- Any number of labels (can be 0), represented as a key-value array
- Current metric value
- Optional metric timestamp
Metric output is typically preceded with # HELP and # TYPE metadata lines.
The HELP string identifies the metric name and a brief description of it. The TYPE string identifies the type of metric.
example metric
# HELP metric_name Description of the metric
# TYPE metric_name type
# Comment that's not parsed by prometheus
http_requests_total{method="post",code="400"}  3   1395066363000
Prometheus metrics / OpenMetrics types
- Counter - represents a cumulative metric that only increases over time, like the number of requests to an endpoint.
- Gauge - Gauges are instantaneous measurements of a value. They can be arbitrary values which will be recorded. Gauges represent a random value that can increase and decrease randomly such as the load of your system.
- Histogram - samples observations (usually things like request durations or response sizes) and counts them in configurable buckets. It also provides a sum of all observed values.
observability platforms
- aws x-ray
- honeycomb
- lightstep
- grafana
- splunk
- dynatrace